As a .NET solution grows, the time spent on Roslyn analyzers during compilation increases. I have witnessed a web solution where the execution time of the Roslyn analyzers was simply absurd. In particular, the ratio was 70% of the time spent on the Roslyn analyzers and 30% on the rest of the compilation. The total build time was about 2 to 3 minutes depending on the machine’s specifications.
Such a compilation duration has a direct impact on three points:
- The productivity of developers, whose time spent waiting each day can reach significant values.
- Metrics related to delivery and continuous deployment. A slower compilation means longer validation times for pull requests and release publications.
- The satisfaction and motivation of developers, who are frustrated by waiting with each code change.
The compilation duration of a .NET solution can be justified by several aspects, including the amount of code, dependencies between projects, coupling between projects, etc. In this first article, we will focus only on the impact of Roslyn analyzers on the compilation time. After reading this article, you will be able to identify their impact on your .NET solutions and take action to reduce it, without neglecting the quality and assurance they provide.
The usual suspects
Before going any further, let’s look at some well-known Roslyn analyzers that may already be enabled in your solutions.
.NET includes Roslyn analyzers for code style and quality. These are the rules with codes starting with CAxxxx, CSxxxx, and IDExxxx. Depending on the target framework, a subset of these analyzers is enabled by default. The AnalysisLevel property can be changed to include more or fewer rules.
Several well-known NuGet packages such as xUnit.net, FluentAssertions, StyleCop, Entity Framework Core, and others include by default a significant number of Roslyn analyzers. They help you adhere to the conventions and best practices of these libraries.
The problem is that you may not need all the analysis rules included in these packages. Recently, I became aware of a recent .NET solution that had a transitive reference to Entity Framework Core, while the latter was not used. After analysis, I discovered that the Entity Framework Core analysis rules added a second to the total compilation time. Let’s find out how I proceeded to identify this problem.
Analyzing the impact of Roslyn analyzers on compilation time
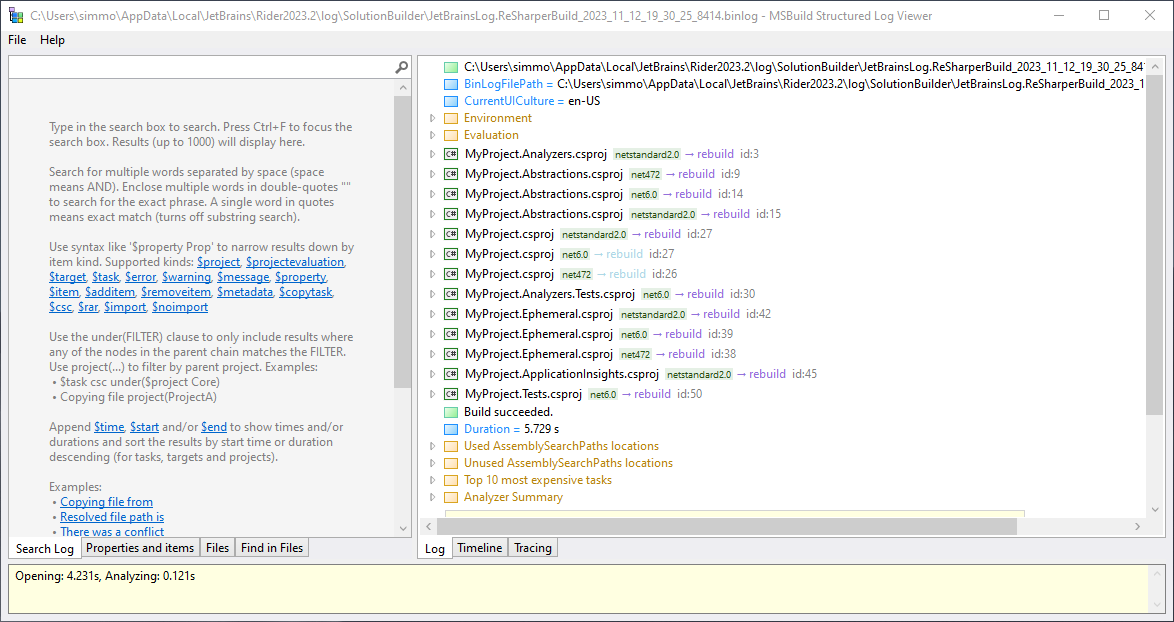
To begin, you’ll need to install an external tool created by Kirill Osenkov. Kirill is an absolute expert in MSBuild and a Principal Software Engineer at Microsoft. He developed a tool called MSBuild Structured Log Viewer, which allows you to read compilation logs generated by MSBuild. Follow the link and install it.
Secondly, you will need to enable analyzer reporting during the compilation of your projects. This can be accomplished by adding this line to your project. Ideally, you should add it to all your projects in your solution, and the most efficient way to do this is to use a Directory.Build.props file at the root of your solution.
<Project>
  <PropertyGroup>
    <ReportAnalyzer>true</ReportAnalyzer>
  </PropertyGroup>
</Project>
Thirdly, you need to compile your solution and generate a *.binlog file. You can do this from the command line with the following command:
dotnet build /bl
/bl is shorthand for /binarylogger. Once the compilation is complete, you should have a *.binlog file in the root folder of your solution or project. Double-click this file to open it with MSBuild Structured Log Viewer.

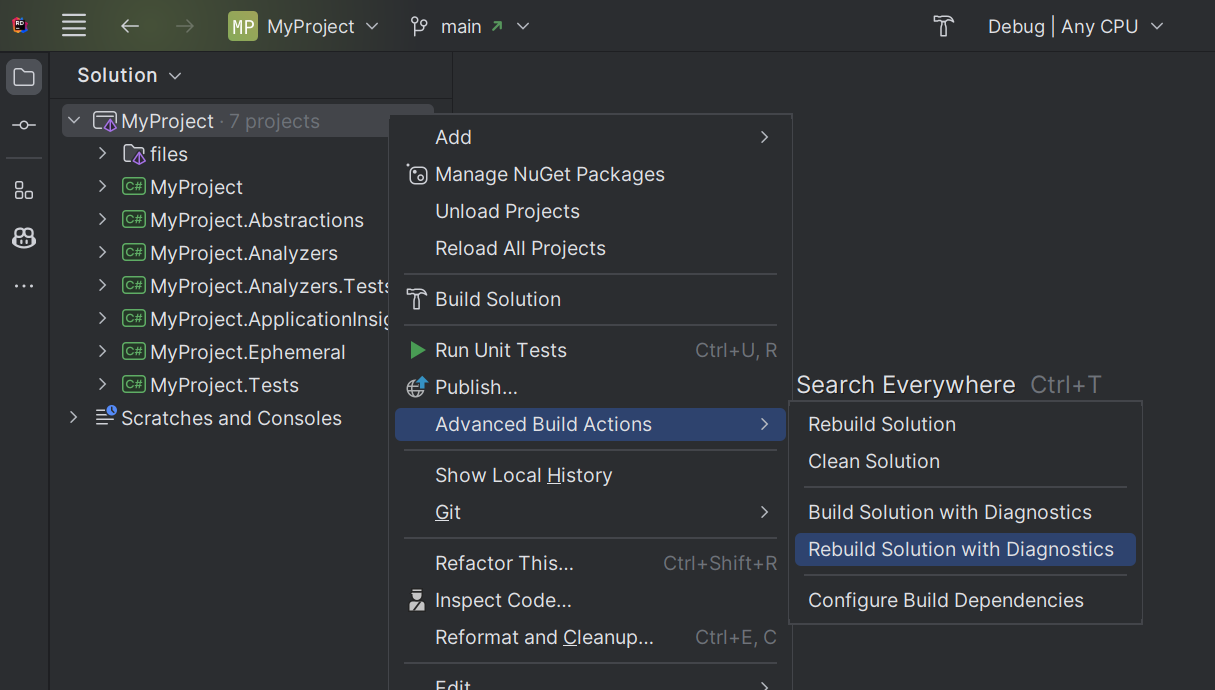
Rider users are in luck because they don’t need to run any CLI commands. The integration of MSBuild Structured Log Viewer is included. Right-click on a project or solution, choose “Advanced Build Actions,” and click on “Rebuild Solution with Diagnostics” for a whole solution, or “Rebuild Selected Projects with Diagnostics” for one or more individual projects. The log viewer will automatically open after the compilation.

Identifying the Roslyn analyzers with the most impact
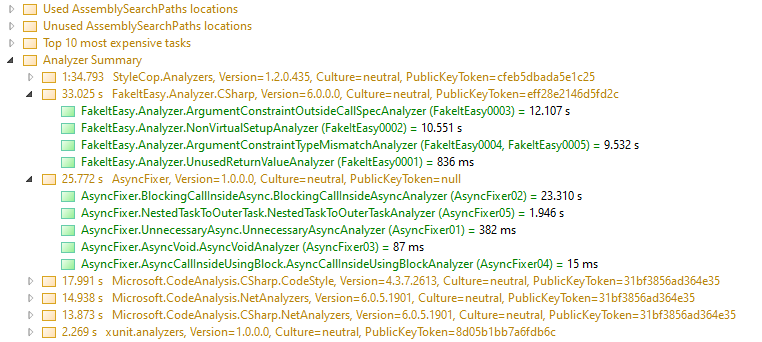
When you open a binary log file created with the ReportAnalyzer property set to true, MSBuild Structured Log Viewer displays an Analyzer Summary section at the bottom of the main tree view. This section can be expanded, and you will then have a detailed analysis of each Roslyn analyzer, from the slowest to the fastest. Each Roslyn analyzer can also be expanded to display the individual rules that were executed, with their execution time, and also in the order from slowest to fastest.
In this example project (which is real), we can see that some Roslyn analyzers have a significant impact on compilation time. In particular:
- StyleCop has a huge impact, with more than a minute and a half.
- FakeItEasy has a considerable impact of over 30 seconds.
- AsyncFixer adds almost 30 seconds.
It is important to clarify that code analysis is generally executed in parallel, which means that the total execution time of Roslyn analyzers is not the sum of each rule.

An experienced developer might wonder, for example, if AsyncFixer is really necessary. The recent versions of .NET (6, 7, 8) include more and more Roslyn analyzers aimed at increasing code quality, particularly with the use of async/await. However, few people know that certain rules need to be activated with the AnalysisLevel property, for example:
<PropertyGroup>
  <!-- Enables all .NET built-in analysis rules that come from the .NET 6 SDK -->
  <!-- Simply a must-have for projects targeting .NET Standard 2.0 as the default level is very low -->
  <AnalysisLevel>6.0-All</AnalysisLevel>
</PropertyGroup>
Disabling unnecessary Roslyn analyzers
Once you have identified the Roslyn analyzers that have the most impact on compilation time, you can do some research and decide as a team if certain rules are necessary or not. If you decide to disable some rules, the quickest way to do so is to create an .editorconfig file at the root location of your solution. In this example, I disable the StyleCop analysis rule SA0001, as well as several rules from the AWS SDK which is referenced transitively in my project, but which I do not use.
[*.{cs,vb}]
dotnet_diagnostic.SA0001.severity = none
dotnet_diagnostic.SecurityTokenService1000.severity = none
dotnet_diagnostic.SecurityTokenService1001.severity = none
dotnet_diagnostic.SecurityTokenService1002.severity = none
dotnet_diagnostic.SecurityTokenService1003.severity = none
dotnet_diagnostic.SecurityTokenService1004.severity = none
Refer to this Microsoft documentation to learn more about how to suppress warnings from Roslyn analyzers.
Compile production builds faster
If your team works with pull requests to merge your features into the main branch, there’s a good chance you have quality gates in place that ensure your project compiles successfully, your tests are green, there are no warnings and errors, etc. This usually means that the code in the main branch is of high quality and can potentially be deployed to production.
Considering that the code analysis rules have already been run during CI, it may not be necessary to burden the compilation time of the production deliverable with additional code analysis. You can simply disable the execution of Roslyn analyzers by modifying the dotnet build or dotnet publish command with the RunAnalyzers property set to false:
dotnet build -c Release -p:RunAnalyzers=false
In my example project, disabling code analysis reduces the compilation time from ~2 minutes to less than 50 seconds!
If your team has a very high velocity and you deploy to production several times a day, this can have a significant impact on your delivery and continuous deployment metrics. If you use a cloud provider to compile your Docker images, this can also reduce your costs.
Conclusion
In this first article of a series concerning the optimization of the compilation time of .NET solutions, we have seen how to identify the Roslyn analyzers that have the most impact on compilation time. We have also seen how to disable code analysis rules that are not necessary, and how to disable the execution of Roslyn analyzers during the compilation of production deliverables.
I hope this article has been helpful to you. Feel free to react in the comments or contact me on Twitter @asimmon971.
