The .NET team recently released the Aspire dashboard as a standalone Docker public image. This can be easily used as an OpenTelemetry exporter to collect and display the traces, metrics, and structured logs generated by your applications during local development. The Aspire dashboard can be used to visualize telemetry emitted by any application using the OpenTelemetry SDK which is available for .NET, Java, JavaScript, PHP, Python, and many others runtimes.
Previously, the recommended solution was to use Docker Compose to bootstrap a complex setup including components such as OpenTelemetry Collector, Grafana, Loki, Jaeger, Zipkin, Prometheus, and others. It was just too much. At the end of the day, most developers simply want to visualize their application telemetry, not learn to become YAML engineers.
This article has been updated for .NET Aspire’s general availability.
Start the standalone Aspire dashboard
Ensure you have Docker started on your machine. Then, execute the following command to start the Aspire dashboard:
docker run --rm -it -p 18888:18888 -p 4317:18889 -d --name aspire-dashboard -e DOTNET_DASHBOARD_UNSECURED_ALLOW_ANONYMOUS='true' mcr.microsoft.com/dotnet/aspire-dashboard:8.0.0
This command starts a container from the mcr.microsoft.com/dotnet/aspire-dashboard image and exposes ports 18888 and 4317 on your local machine. Port 18888 is used to access the UI of the dashboard, while port 4317 is used to receive telemetry in accordance with the OpenTelemetry Protocol (OTLP).
The DOTNET_DASHBOARD_UNSECURED_ALLOW_ANONYMOUS environment variable is set to true to skip the login page that has been added in preview 6. As long as you are running the dashboard locally, this should be fine. Consider securing the dashboard otherwise.
Modify your apps to emit OpenTelemetry data
In your applications, install and configure the OpenTelemetry SDK corresponding to the technology or language you are using, and start them by providing the following environment variable. I provide a complete code sample at the end of this article for .NET.
OTEL_EXPORTER_OTLP_ENDPOINT="http://localhost:4317"
OTEL_SERVICE_NAME="your-app-name"
Then, use your application and make sure it generates telemetry.
Visualize your OpenTelemetry data
The Aspire dashboard is accessible at http://localhost:18888 in your browser. Here you can visualize the traces, metrics, and structured logs emitted by your applications.
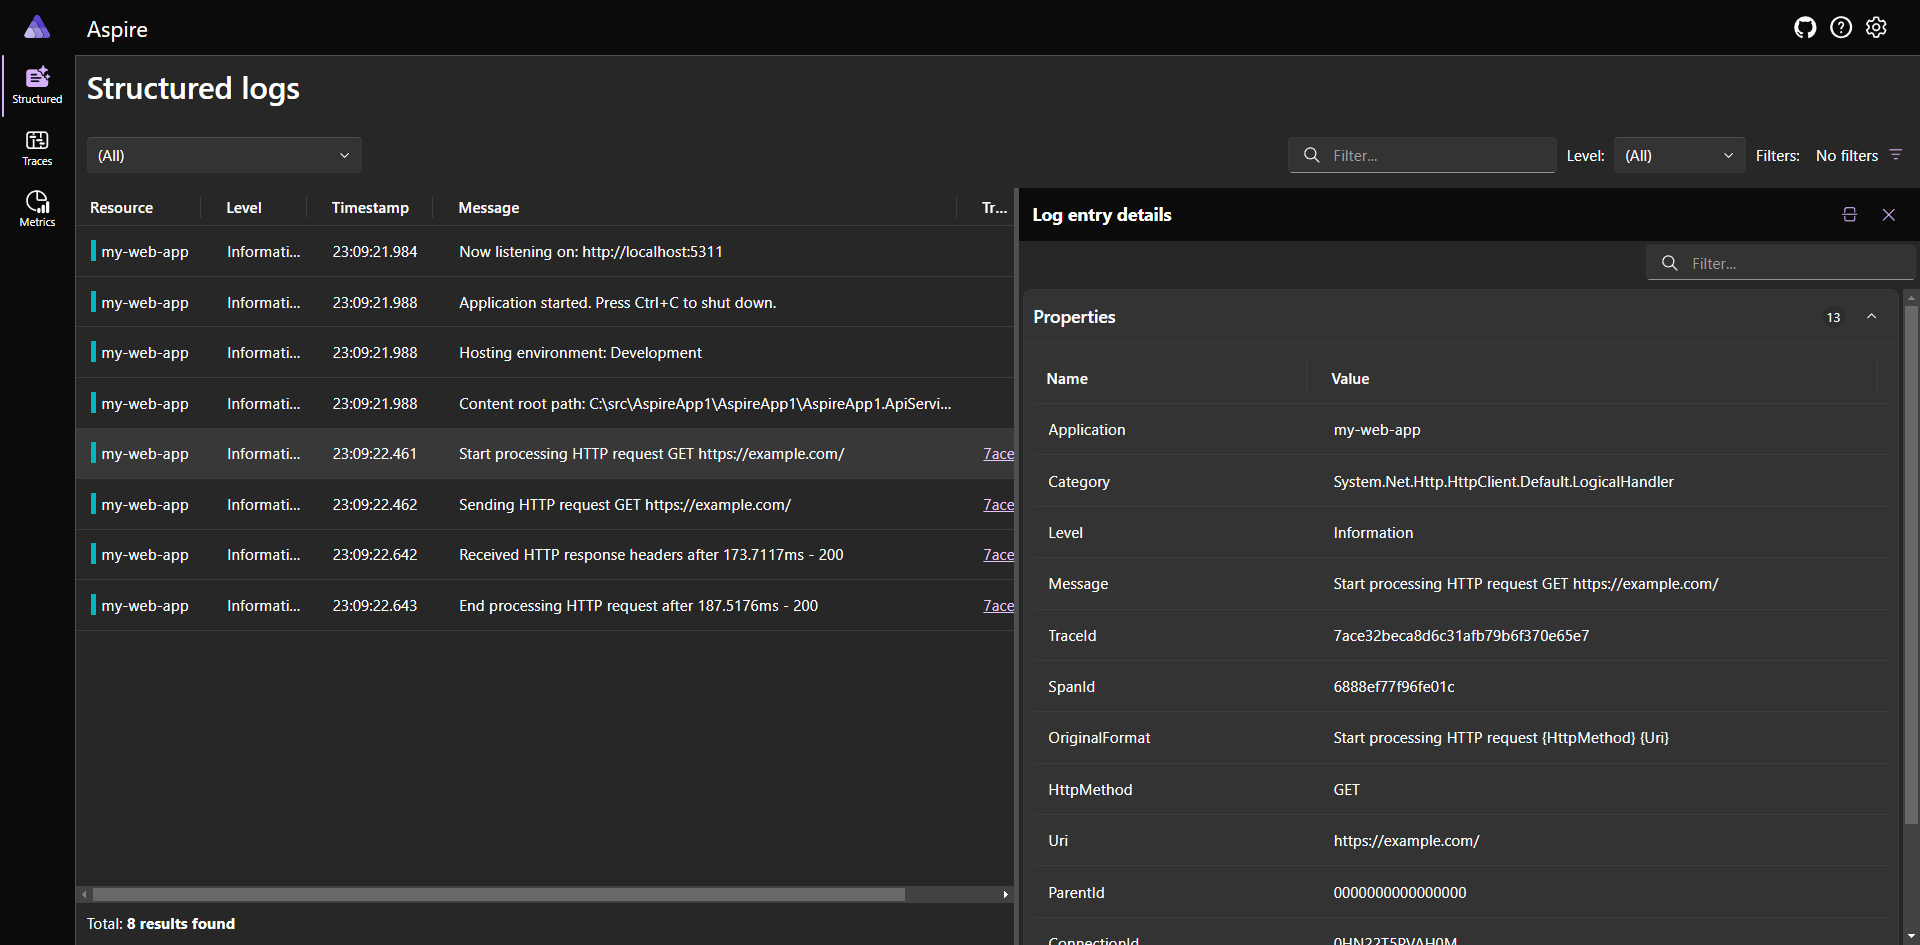
Here is the structured logs screen, with the ability to view the details of each:
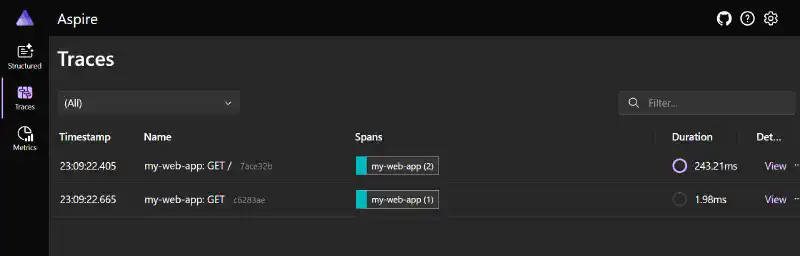
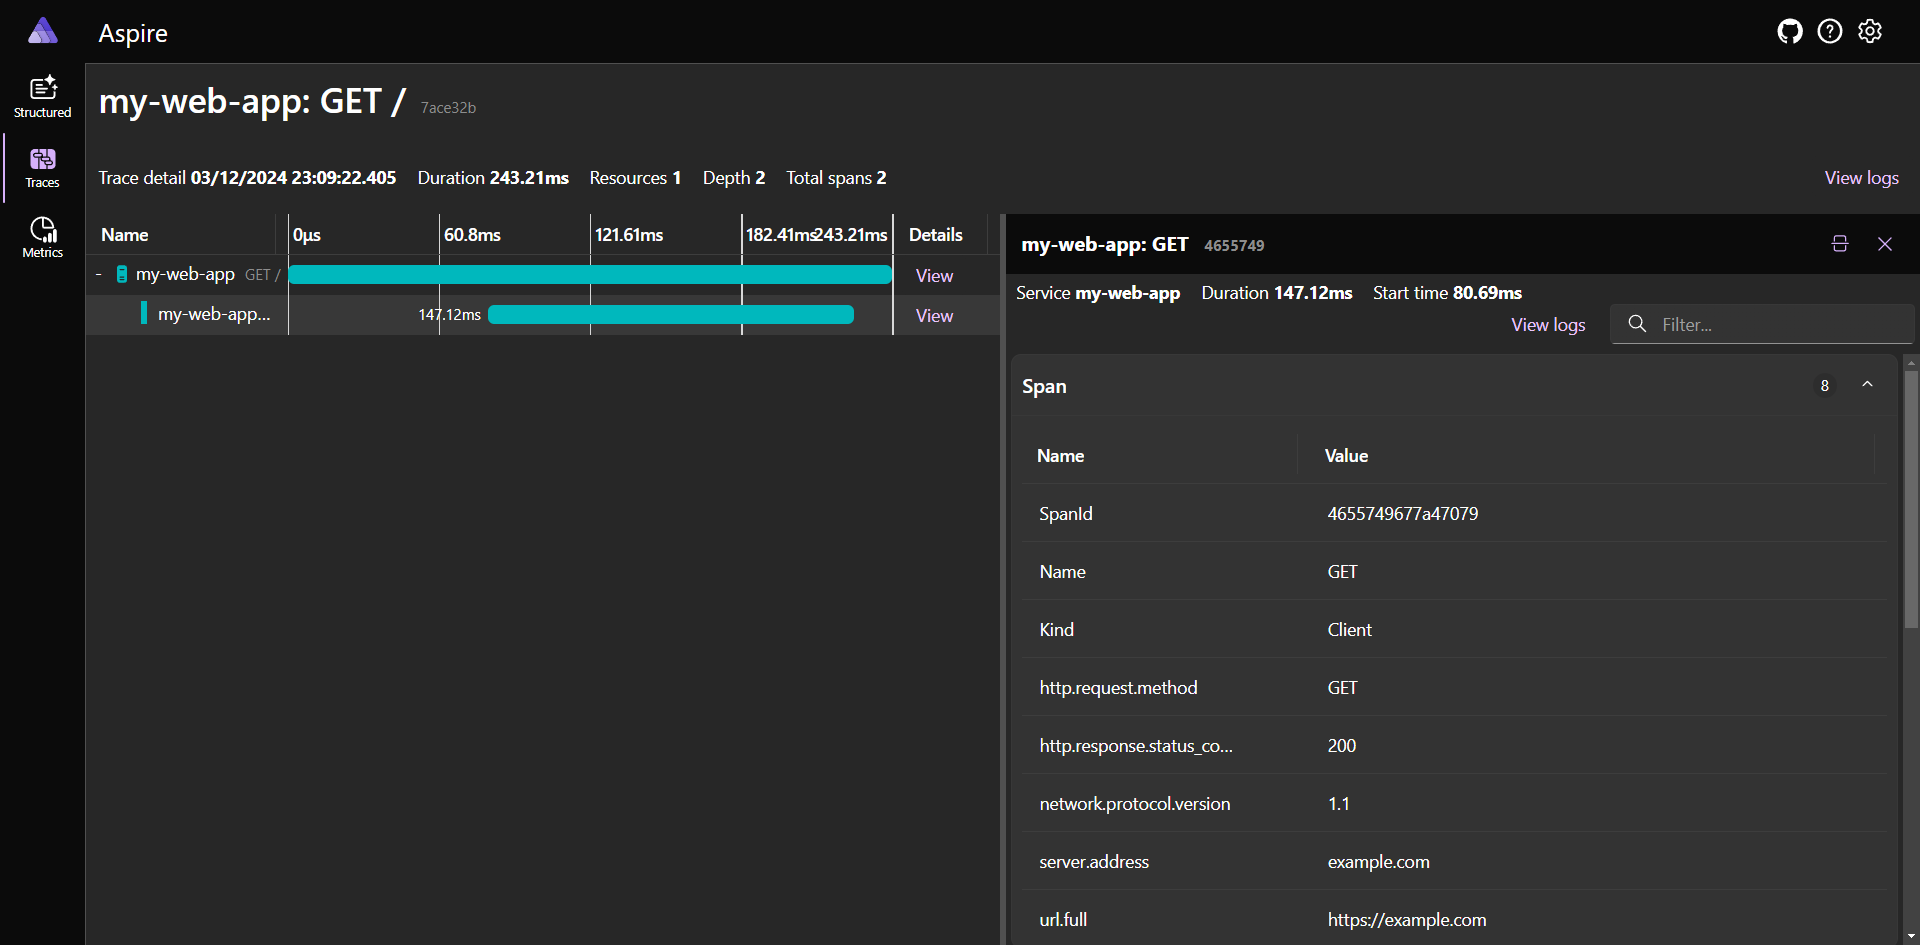
The traces screen, currently focused on a specific trace:
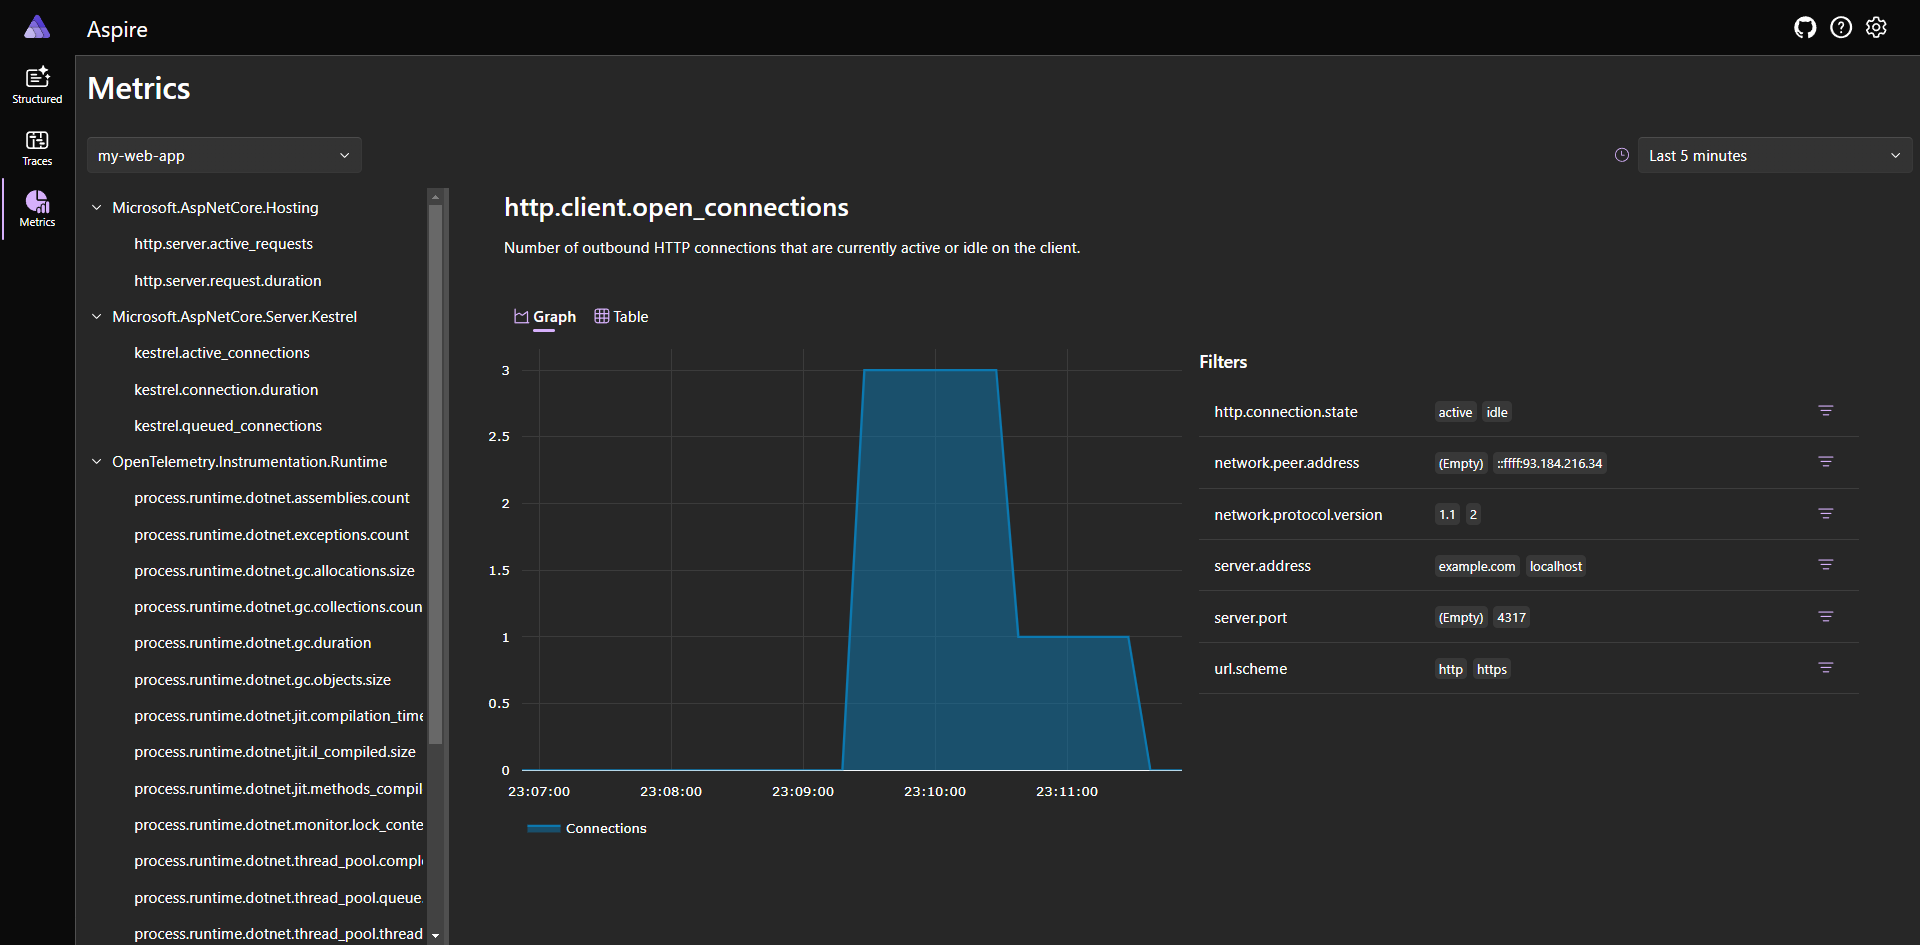
And finally, the metrics screen:
Bonus: complete code sample for ASP.NET Core
Create a blank ASP.NET Core application and install the following packages (note that newer versions may be available since the publication of this article):
<PackageReference Include="OpenTelemetry.Exporter.OpenTelemetryProtocol" Version="1.8.1" />
<PackageReference Include="OpenTelemetry.Extensions.Hosting" Version="1.8.1" />
<PackageReference Include="OpenTelemetry.Instrumentation.AspNetCore" Version="1.8.1" />
<PackageReference Include="OpenTelemetry.Instrumentation.Http" Version="1.8.1" />
<PackageReference Include="OpenTelemetry.Instrumentation.Runtime" Version="1.8.1"/>
Next, replace your Program.cs with the following code:
using OpenTelemetry;
using OpenTelemetry.Metrics;
using OpenTelemetry.Trace;

var builder = WebApplication.CreateBuilder(args);

builder.Logging.AddOpenTelemetry(logging =>
{
    logging.IncludeFormattedMessage = true;
    logging.IncludeScopes = true;
});

builder.Services.AddOpenTelemetry()
    .WithMetrics(metrics =>
    {
        metrics.AddRuntimeInstrumentation()
            .AddMeter("Microsoft.AspNetCore.Hosting", "Microsoft.AspNetCore.Server.Kestrel", "System.Net.Http");
    })
    .WithTracing(tracing =>
    {
        tracing.AddAspNetCoreInstrumentation()
            .AddHttpClientInstrumentation();
    });

var useOtlpExporter = !string.IsNullOrWhiteSpace(builder.Configuration["OTEL_EXPORTER_OTLP_ENDPOINT"]);
if (useOtlpExporter)
{
    builder.Services.AddOpenTelemetry().UseOtlpExporter();
}

var app = builder.Build();

app.MapGet("/", () => "Hello world");

app.Run();
Finally, here is the content of the appsettings.Development.json file:
{
  "Logging": {
    "LogLevel": {
      "Default": "Information",
      "Microsoft.AspNetCore": "Warning"
    }
  },
  "OTEL_EXPORTER_OTLP_ENDPOINT": "http://localhost:4317",
  "OTEL_SERVICE_NAME": "my-web-app"
}